The Colorado Springs and El Paso County Regional Housing Needs Assessment provides a comprehensive analysis of current and future housing needs within the city limits of Colorado Springs and unincorporated El Paso County. Conducted in compliance with Colorado Senate Bill 24-174, the assessment integrates quantitative data with extensive community engagement to evaluate housing challenges, gaps, and opportunities. The report also addresses other municipalities across El Paso County to support compliance with SB 24-174. These findings are intended to inform local policy, guide resource allocation, and support a more balanced housing market.
View the Housing Needs Assessment by Section
- Executive Summary
- Introduction & Methodology
- Demographic Trends
- Economic Trends
- Housing Inventory
- Housing Market Trends
- Housing Problems
- Current & Projected Housing Needs
- Community & Stakeholder Engagement
- Housing Resources
- Public & Institutionally Owned Land
- Housing Development Challenges & Opportunities
- Policy & Program Recommendations
- SB 24-174 Data for El Paso County Municipalities
- Appendix A - Homelessness Analysis
- Appendix B - Military Housing Analysis
- Appendix C - Community Questionnaire Results
- Appendix D - El Paso County Municipality Summary Pages
Dashboards
The dashboards below provide two ways to explore data about local housing conditions. Click to expand the instructions below to learn how to use the dashboards:
Dashboard Instructions
Summary Section
View key housing trends, challenges and opportunities across the entire region at a glance. These metrics help explain the big picture before diving into local details. The numbers in this section reflect data for any census tracts visible in the map, and they will update as users navigate, pan, and zoom within the map. These summary metrics will not change when a single census tract within the map is clicked.
Interactive Map
Explore neighborhood-level data by panning, zooming, and clicking on individual census tracts. Explore map layers to view different types of data. Clicking on a single census tract will open a pop-up with more detailed information.
Navigation Instructions
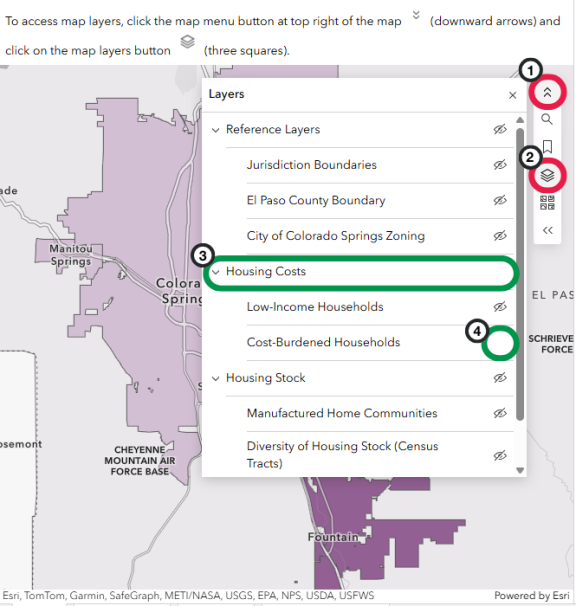
- To access map layers, click the map menu button at the top right of the map (two downward arrows).
- Then click on the map layers button (three stacked squares).
- To view different data layers on the map, start by checking the main layer menu (in this example, the main layer is "Housing Costs"). If there is no icon of a crossed-out eye next to it, that means the layer is turned on and visible.
- One a visible main layer is selected and expanded, you'll be able to see and interact with the sub-layers nested underneath it. In the example shown above, the "Cost-Burdened" sub-layer under "Housing Costs" is currently active and displaying data on the dashboard (note: this layer does not have the crossed-out eye icon next to it, indicating that it is visible).
2025 Census Data Dashboard: Explore Housing in Your Community
This dashboard displays local housing conditions using census tracts, which are small geographic areas designed to reflect neighborhood-level patterns. To learn more about this data and how to use this dashboard, check the “Introduction” tab located behind the map.
2025 Housing Needs Assessment Dashboard: Explore Regional Housing Trends
This dashboard displays housing data developed during the 2025 Colorado Springs and El Paso County Regional Housing Needs Assessment. To learn more about this data and how to use this dashboard, check the “Introduction” tab located behind the map.