Where we are and where we are going?
What is a PlanCOS Snapshot?
These PlanCOS Snapshots were integral to the process of creating this Plan including its Vision and Themes. They provide a quick overview of key subjects and trends both presented to and identified by the community during the stakeholder input process. They include input from the Colorado Springs community, Co-Creators, and the Technical and Steering Committees, along with data and document analysis by contributing subject matter experts. They provide the reader high level background and understanding about these key topics, as well as a baseline for ongoing discussion and evaluation of information and trends important to the city’s physical development future.
The PlanCOS Snapshots are just that; snapshots of key information assembled and synthesized near the beginning of the PlanCOS process. This information is not represented as being complete and entirely up-to-date in all cases. Unlike the content of the main body of this Plan, these Snapshots have not been thoroughly reviewed and validated in detail by the full spectrum of PlanCOS participants. Some of this information is particularly susceptible to becoming dated or less applicable over time. Therefore, as PlanCOS is applied, evaluated, implemented, and amended over time, new and updated information should be considered as appropriate.
Unique Places
Growth + Demographics
What We Should Know About Who We Are And How We Grow
With a land area of 195 square miles and a 2017 population of 467,108, Colorado Springs is Colorado’s largest city by area, and second only to Denver in population. By population, we are now the 40th largest city in the country. By 2040, our City could have well over 600,000 people, and El Paso County is expected to be home to almost 1,000,000 people. Regardless of the exact rate of growth, twenty years from now our senior population is projected to increase extraordinarily and we are projected to be considerably more diverse.
Historic City Growth
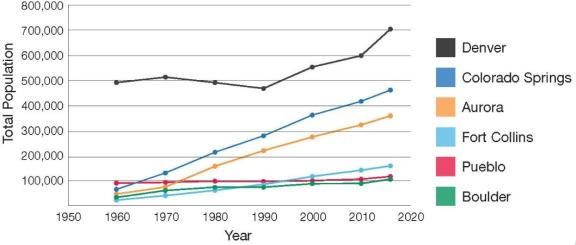
Colorado Springs has seen extraordinary population growth over the last 50 years, establishing itself as a strong urban hub for southern Colorado. Since the 1960s its annual population growth has been greater than the majority of cities in Colorado. Although the City’s long-term rate of population growth has slowed somewhat compared with the period from the 1950s through the 1980s, the City continues to grow at rates considerably above the national average. It is expected to match Denver’s population in the future.
Comparative Population Growth 1960-2017
Unprecedented Regional Growth
El Paso County will see over a quarter of a million new people by 2045, and the population for the City will likely be home to about 2/3rds of these residents. By that time, Colorado Springs will grow to be the size of the current City and County of Denver, but with a significantly different outlook: Colorado Springs will still have room to grow, while Denver is already land locked. A significant amount of growth continues to occur outside of the City. This trend will continue to result in challenges for the fiscal sustainability of the City. Although the City’s share of the County population has declined over most of the last several decades, recent data show that this trend may decline in the future due in part to demographic shifts and more urban housing choices.
| Year | El Paso County | Colorado Springs | Percent of County |
|---|---|---|---|
| 2017 Population | 701,283 | 467,108 | 66.6% |
| 2025 Projected | 740,069 | 498,788 | 67.4% |
| 2030 Projected | 797,126 | 526,863 | 66.1% |
| 2035 Projected | 853,580 | 536,885 | 62.9% |
| 2040 Projected | 909,947 | 549,481 | 60.4% |
| 2045 Projected | 960,800 | 573,461 | 59.7% |
These projections are derived from the current 2017-18 Pikes Peak Area Council of Governments Small Area Forecasts which allocate population based on an overall El Paso County control total provided by the Colorado State Demographer. These projections assume a high proportion of regional growth will occur in areas outside the city limits of Colorado Springs and therefore they differ with other assumptions in PlanCOS.
Growing Young and Old Populations
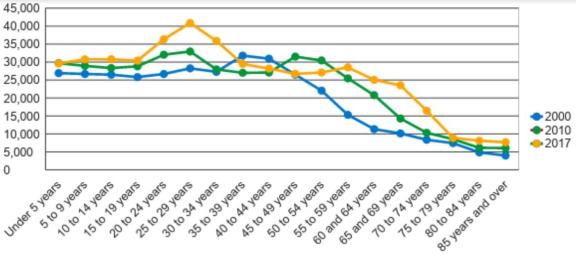
The proportion of Millennials living in the city is increasing, and furthermore, the 20-30 year old age group is by far the largest for in-migration, and is the most important for fueling the city’s growth. This demand is driven, in part, by the strong military presence. Without appropriate housing types, jobs, and urban amenities, we have the potential of losing a share of this important segment of our population.
But Millennials are not the only generation that is growing; the Colorado Springs population is also getting older. There are now over 50,000 people 65 years or older, an increase of 50% since 2000, much of which is attributed to the Baby Boomer generation.
Population by Age, 2000, 2010 and 2017
Land Use
What We Should Know About How And Where We Build
Future city growth over the next 20 to 30 years can be accommodated within our existing or modestly expanded boundaries. Currently, over 25% of the City is vacant and undeveloped. The majority of this area is in Banning Lewis Ranch, but many additional opportunities for redevelopment and infill exist. Although our mix of land uses is in overall balance with the market, there are inefficiencies in how some uses are distributed throughout our community. The location, quality, and intensity of existing land uses should be expected to change in the future. In particular, this will impact the redevelopment of existing areas, such as older arterial corridors.
Rethinking Location, Intensity and Design
Taking up the largest portion of the City are properties with conventional residential zoning. These account for just over 41% of the land area. The second largest zoning category is Planned Unit Development, which allows a mix of property-specific uses, most often residential. PUD zoning can allow for increased land use diversity, density or enhanced public amenities. Another 11% of the City’s land is zoned for office, business and employment uses, and 9% for industrial. The last 1% includes other special uses and areas with traditional neighborhood and form-based design. Although the City is comprised of a healthy mix of land uses, not all of them are located in optimal locations or have resulted in the desired intensity of quality.
The Importance of our Military Presence in City Building
With nearly 170 square miles of military land in and around the City that employ or house over 175,000 people, the military is a clear economic driver for the region. This strong presence has both benefits and challenges. As the largest military installation, Fort Carson alone has an associated population of close to 125,000; with 26,282 on active duty and another 98,409 retirees, family members, and civilian employees. Many of these individuals live, shop or recreate in Colorado Springs. The impact of this presence can be seen in the workforce, job availability, services and housing type and tenure. Peterson Air Force Base is unique in that it is entirely surrounded by and included within our city limits. Through the Joint Land Use Study (JLUS), the City is collaborating with these institutions and planning for the areas surrounding the bases in order to support resident life on the bases. While the military bases are anticipated to continue to be a stable economic force, at some point overall City growth is expected to outpace military expansion. This will underscore the importance of leveraging the military presence to attract and target related industries.
| Base | Active Duty |
Retirees, Family Members or Civilian Employees |
Reservists | Total |
|---|---|---|---|---|
| Fort Carson | 26,282 | 98,409 | - | 124,691 |
| Schriever AFB | 1,618 | 7,583 | 469 | 9,670 |
| Peterson AFB | 6,750 | 26,101 | 1,525 | 34,376 |
| Air Force Academy | 5,701 | 1,875 | - | 7,576 |
| Total | 40,364 | 132,994 | 1,993 | 176,313 |
Source: Schriver AFB Economic Impact Statement FY 2015; Military Installations: http://www.militaryinstallations.dod.mil/MOS/f?p=MI:ENTRY:0
We Know Where We Are Growing

The majority of the lands identified as vacant or planned for development are located on the east and north edges of the City, although vacant and re-developable infill properties are scattered throughout the City. Most areas anticipated for growth and development over the next 20 years have already been annexed into the City. The majority of the vacant/developable land is within the approximately 24,000-acre Banning Lewis Ranch (BLR), the largest of the master planned developments.
In order to accommodate an anticipated 100,000 more people in the coming decade, the City will most likely need to employ a strategy of both new greenfield development and infill/redevelopment. Infill and redevelopment may be a priority, because sites adjacent to developed areas are more easily and efficiently connected to services and infrastructure, can take advantage of existing capacity, and can reduce the potential for blight and disinvestment in mature areas. However, even with a focus on infill and redevelopment, the development of Banning Lewis Ranch is expected to play an important role in addressing population and employment demand.
Kinds of Development
- GREENFIELD - Development of previously undeveloped or vacant sites. These areas are generally located outside or on the fringe of urban areas.
- INFILL - Development of vacant land within previously built areas. These areas are already served by public infrastructure, such as transportation, water, wastewater, and other utilities.
- REDEVELOPMENT - Converting an existing built property into another use. Ideally, redevelopment aims for better use of the property that provides an economic return to the community.
Why Are We Still Growing Outward?
A significant amount of investment is necessary to see additional growth happen within our infill, redevelopment, and large greenfield areas. Due to a combination of costs and market demand, a substantial amount of development is still occurring outside both the city limits where development standards and requirements are lower. If new residential development growth occurs outside the city boundary, but within driving distance of the jobs and services in Colorado Springs, the development could change planned infrastructure needs including utilities, traffic, and the nature of the development.
A significant proportion of the periphery of the city now consists of large lot residential development served by individual wells and septic systems. As the city continues to grow out to and sometimes surround these rural residential areas, there will be challenges in matching up uses, services, and infrastructure. Additionally, almost 40 County enclaves within the city limits have not been annexed. With the exception of Cimarron Hills, most of these enclaves do not have a full range of urban services, and they do not contribute tax revenues to the City.
Vibrant Neighborhoods
Housing
What We Should Know About How And Where We Live
Families continue to be attracted to Colorado Springs’ housing quality and affordability, and much of the new housing stock will continue to be built as single-family homes. However, an increasing proportion of housing will need to meet the changing demand for smaller, multifamily, and specialized units, and to address our ongoing imbalance in affordable/attainable housing. These shifts in the housing market will be driven by increases in the young, senior, and one- and two-person households, as more than one quarter of households now consist of people living alone. In the near term, there is pent-up demand for quality infill and redevelopment units in Downtown and other urban neighborhoods, particularly for the local workers. Going forward, new and existing suburban neighborhoods should expect to incorporate a wider variety of unit sizes, densities, and types, which offer the chance for residents to up- or downsize while remaining in their chosen neighborhood.
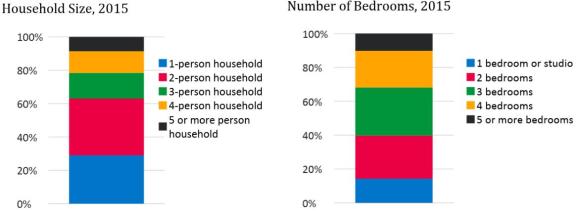
Small Households Drive Growth
Our growing population creates a demand for new non-traditional housing needs in the form of smaller housing units. This is combined with a relatively small household size of approximately 2.48. Seniors and Millennials are expected to grow the most, while boomers are expected to decline in proportion to the general population. The baby boomer generation, has shifted upward in age –a phenomenon to which the housing market will be required to respond to with a housing supply suited to a larger number of elderly households. This will likely translate to increased demand for accommodations that would allow such households to age in place. Very young households have similar needs, often looking for “starter” homes that are affordable, manageable, and appropriate for smaller household sizes.
Need to Match our Housing Stock to Our Future Demand
The choices that Colorado Springs residents make represent the continuation of national trends that impact what households look like today including wealth, mobility, delay of marriage, increased longevity, and a departure from traditional family structures. There are over 50,000 single-person households in Colorado Springs, which translates to 29% of all households citywide. Given this increase in smaller households, there is an inadequate supply of smaller housing units; close to 60% of units have 3 or more bedrooms, whereas only 37% of households have 3 or more people. Although 29% of the population lives alone, only 14% of the units are 1 bedroom or studio units.
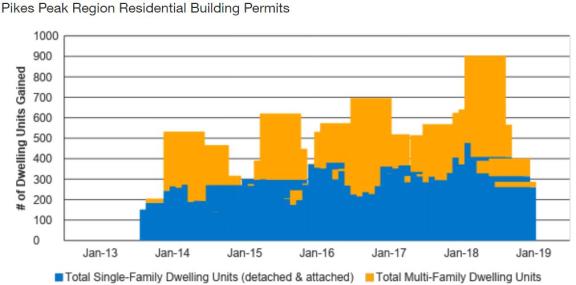
Housing Demands Point to More Infill
There is a capacity for infill development, which could accommodate a substantial proportion of housing needs. As of 2017, there were about 6,700 acres of vacant parcels in the core area of Colorado Springs. While this vacant acreage is steadily decreasing, and not all of this property is easily developable, it represents ample redevelopment opportunities. Until recently, the overwhelming majority of new housing units have been built on the edges of the developed area of the City. While greenfield development continues to account for a majority of new housing, infill areas are beginning to capture a larger share. For example, as of 2018, over 500 new residential units have been or are being added in the Downtown area.
Millennials and young professionals will continue to drive the demand for infill housing. In combination with older “empty nesters,” they also are the most likely demographic to prefer apartment living, rental housing, and an urban walkable environment, and they are least reliant on owning a car. The proportion of Millennials living in the City is increasing, and furthermore, the 20-30 year old age group is by far the largest for in-migration, and is the most important for fueling the City’s growth. This demand is driven, in part, by the strong military presence. Without appropriate housing types, we have the potential of losing this population. There is also demand for infill housing among a segment of Baby Boomers. While many want to remain in their home, over half are looking to downsize. An even larger segment may not have a choice as they age, as finances will become more constrained.
New Types of Living
A majority of Boomers desire to “age in place.” We are also seeing a demand for new types of communities. National trends show suburban development adapting to these desires and future needs. One model that has potential in Colorado Springs is the Lifestyle Master-Planned Community. Lifestyle MPCs offer a wide range of housing types (including single-family, townhomes, and co-housing) and price points, as well as a strong focus on community amenities. Successful examples that can serve as models for the City include Daybreak (located in the Salt Lake City metropolitan area) and Viridian (Dallas metropolitan area). Other housing developments are turning their focus to healthy living, variety of housing types, technology and unique neighborhood gathering spaces. These kinds of communities will be increasingly necessary to capture and keep young families.
Strong Connections
Transportation
What We Should Know About How We Get Around
In 2004 and 2012, voters in Colorado Springs and surrounding communities passed a one-cent sales tax to fund transportation and transit maintenance and improvements, demonstrating that our citizens value a transportation system that efficiently moves people and goods. In late 2015, city voters approved a 5-year 0.62% sales tax increase for maintenance of our almost 6,000 lane miles of existing roadways (as of 2018). These transportation-related investments have reduced or mitigated congestion along many of our major corridors, and are beginning to improve our standard of maintenance. Our land use pattern has made us dependent on cars. Multi-modal transportation options (buses/bicycles) are easily available only in parts of our community, and these modes account for only small proportions of overall person miles traveled. Our challenge is to maintain a long-term cost effective and efficient transportation system for the automobile while increasing safe and convenient opportunities for alternate modes of travel.
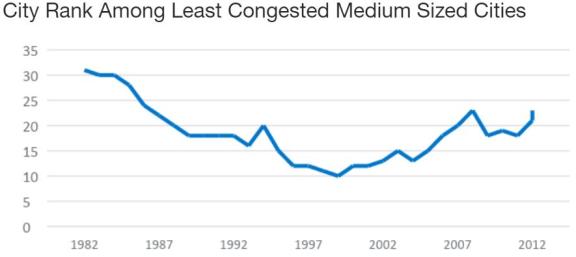
Congestion Levels Better Than Others
The Texas Transportation Institute (TTI) develops congestion statistics for major metropolitan areas in the United States and classifies Colorado Springs and 32 other cities as medium-sized cities. Medium sized cities are generally considered urban areas with population between 500,000 and 1,000,000 people. As shown, in 2013, Colorado Springs was in the top third of least congested medium sized cities.
Since TTI has been recording this data, Colorado Springs’ position on this list declined for almost two decades, but has improved dramatically since the turn of the century. In the early 1980s, the City was one of the least congested medium sized cities. Due to rapid population growth and relatively lack of investment in infrastructure the City through the 1980s and 1990s became one of the more congested medium sized cities. Widening of the I-25 corridor through the City and the City’s PPRTA program of capital improvements has effectively reduced the City’s congestion relative to other similar cities.
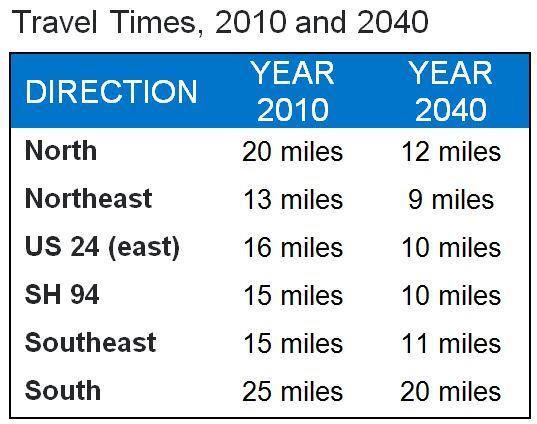
Travel Times set to increase
Transportation needs are not expected to keep pace with projected growth in population and employment through the year 2040. Increasing population growth plus the lack of good east-west corridors is expected to cause the travel length of a 30-minute trip to decrease. This highlights the importance of continuing the PPRTA program after the current program expires in the year 2024 in order to keep Colorado Springs as a city with relatively less congestion than its peer cities.
Cars dominate the road
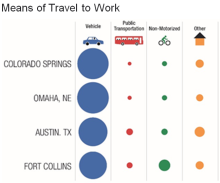
Historically, the automobile has been the predominant means of travel for Colorado Springs residents. Travel mode data shows that about 90% of vehicle-trips are done via a privately-owned automobile. The transit mode split is about 1% and the non-motorized mode split is about 2%. This means that the demand for road infrastructure improvements will continue to be focused on vehicular travel.
Compared to other mid-size, mid-continent cities the mode split of public transportation and non-motorized uses tends to be lower than similar cities. Fort Collins, who has been more proactive in building bicycle facilities citywide, has a non-motorized share of nearly 10%.
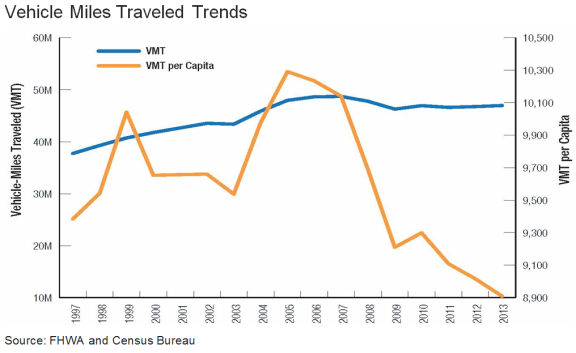
Are We Driving Less?
Vehicle-miles traveled (VMT) per capita in the state of Colorado had been decreasing since 2006, although there has been an increase in overall VMT in recent years, likely due to a combination if a strong economy and sustained low gas prices. However, aspects of this longer term shift appear to be connected to other factors. Evidence suggests that the decline is likely due to the lower auto ownership rates by the Millennial generation, changing demographics and congested highways. This trend suggests two possible outcomes. First, a preference for compact, mixed-use neighborhoods which reduce the need for driving and the potential favoring of other travel modes such as walking and biking and riding transit. Second, declining transportation revenue per capita as less driving would lead to lower per capita fuel usage which would result reduced gas tax revenues to fund transportation infrastructure.
Bicycling
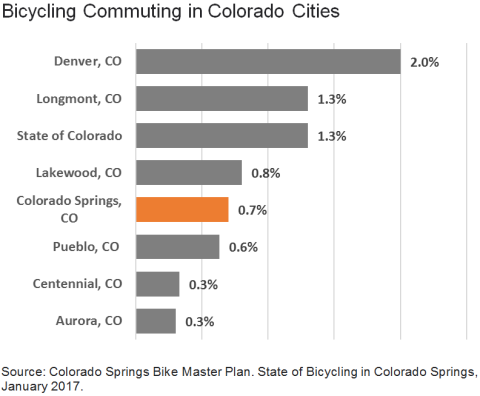
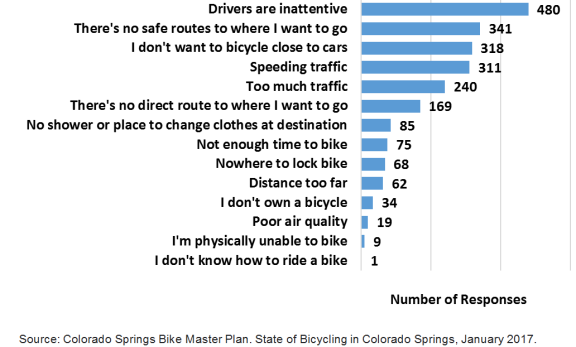
The League of American Bicyclists (LAB) designated Colorado Springs as a Silver Bicycle Friendly Community in 2012 and they noted the strong commitment to bicycling in the community as evident by the large number of bicycling-related organizations and businesses including the United States Olympic Committee, and a supportive city government. However, despite this commitment, Colorado Springs compared to other Colorado cities sees only a small percentage of people bicycling on a regular basis. As shown in the graph, Colorado Springs bicycling mode-share is comparable to Lakewood and Pueblo but overall it is lower than the statewide average. Although not shown the figure, the highest rates of bicycling in Colorado occur in Boulder, CO (11.1 percent) and Fort Collins, CO (7.4 percent). These cities are among the leaders in bicycle commuting nationwide and, as college towns, have very different demographics and land use patterns than Colorado Springs. While there are robust bicycle programs and organizations in the City, they are mostly focused on children and those who already bike instead of the broader population. Furthermore, a 2016 on-line survey targeting Colorado Springs residents indicate that interactions with drivers, high traffic volume and speed, and lack of safe routes are among the strongest deterrents to bicycling. Additional analysis this survey data reveal that respondents would be more comfortable to bike in facilities that were curb-protected or barrier protected.
In response to this current state of bicycling in Colorado Springs, a number of community organizations have passionately expressed an interest in enhancing the City’s bicycling culture and environment. To address these realities and desires, Colorado Springs is currently building on its existing strengths, previous planning work, and community momentum to develop the 2017 Bike Master Plan (Plan). This plan envisions healthy and vibrant Colorado Springs where bicycling is part of the community’s identity and where a well-connected and well-maintained network of urban trails, singletrack, and on-street infrastructure offers a bicycling experience that is safe, convenient, and fun for getting around, getting in shape, or getting away.
Summary of responses to the Questions: "Please indicate why you cannot or do not want to bicycle in Colorado Springs."
How To Stay At The Forefront Of Emerging Technologies

Technology in transportation is moving quickly, with technological innovations in vehicles, the transportation network, and interactions

between the two. Colorado Springs has been implementing some of these innovations as they upgrade their signal system to better manage and operate traffic flows on strategic corridors. These signal system technologies and other new technologies are already seeing widespread implementation to improve safety and traffic flow in Colorado and elsewhere. Examples include:
- Real time weather and traffic conditions information via variable message signs or smartphone applications
- Ramp metering on freeways
- In-vehicle collision warning or blindspot monitoring systems
- Active traffic management to modify signal timing to more efficiently process recurring and non-recurring congestion
- GPS navigation
Other innovations with the potential to dramatically influence transportation in Colorado Springs are certainly on the horizon, although the specific forms and timing of those innovations will evolve over time and cannot be predicted with certainty. Innovations could come in the form of advances in vehicle-to-vehicle (V2V) communications, vehicle-to-infrastructure (V2I) communications and/or autonomous vehicle technologies. Economic and technical innovations have the potential to lead to a shift away from personally-owned modes of transportation to mobility solutions that are consumed as a service (e.g. car share, rideshare).
Colorado Springs Airport
[TBD emplanement trends and a very high level summary of key investments and activities associated with the airport.]
Utilities + Stormwater
What We Should Know About How We Provide Energy And Water
Colorado Springs has made great strides in catching up on prior deficiencies and ensuring that its future infrastructure meets demands. Our per capita utility usage is decreasing due to sustainability and conservation measures; however, as the City continues to grow, overall demand continues to increase for utilities. Stormwater infrastructure will require further development.
Future Infrastructure Spending
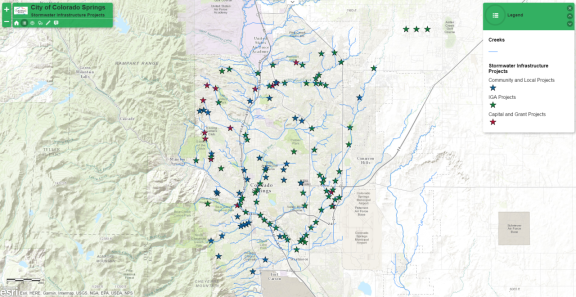
The City of Colorado Springs has recently embarked on a Stormwater Program Implementation Plan to upgrade public stormwater facilities in the City and provide updated guidance for both public and private development.
The City of Colorado Springs and Colorado Springs Utilities (CSU) have committed to spending a minimum of $460 million on stormwater projects in the next twenty years to upgrade and correct deficiencies in the current stormwater system. The projects include protection of property and public safety, detention, sediment/debris capture and control, water quality, channel improvements and protection of utility crossings. In late 2017, City voters approved Issue 2A which authorized a stormwater fee beginning in July of 2018.
City of Colorado Springs Stormwater Projects
Drainage Corridors As Amenities
Drainage corridors and facilities can and should be used as multiuse improvements. Trails and other recreational facilities are ideal to locate along drainageways, providing for multimodal transportation, recreation and scenery. The corridors are also typically utilized for utilities (primarily gravity wastewater facilities), and joint use with trails can facilitate maintenance access and accessibility for these utilities as well as for maintenance of the stormwater facilities.
Declining Wastewater Influent Extends Capacity
As of 2017, CSU treats approximately 38 million gallons of wastewater per day (mgd) at its two wastewater treatment facilities with a system capacity rated at +85 mgd. CSU currently has adequate treatment capacity for the next 10+ years, but is looking at a new treatment facility to potentially be developed east of the city.
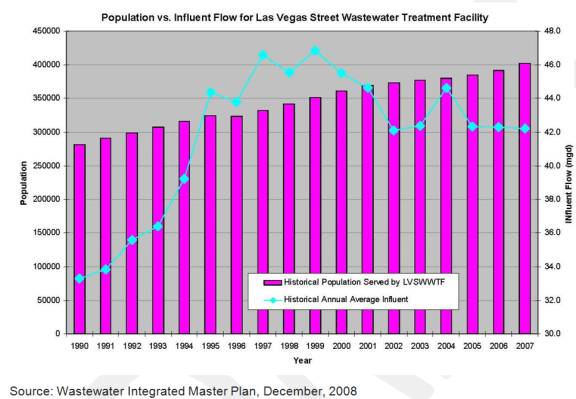
Total influent volumes to CSU’s treatment facilities have been declining to steady over past decades even as the city population has increased. The graphic to the right depicts these trends through 2008, but they have generally been continuing. This is due to water conservation, improvements to the collection system, and annual rainfall. Water conservation strategies include installation of more efficient fixtures in new home construction and renovations. System improvements include replacing or relining of old wastewater mains and manholes which also reduces water infiltration into the system. This decreased per capita influent has resulted in extended capacity for the existing wastewater treatment facilities, reducing the need for additional capacity improvements and capital expenditures. This conservation trend is expected to continue, but the pace of conservation gains is expected to slow.
Wastewater Influent vs. Population
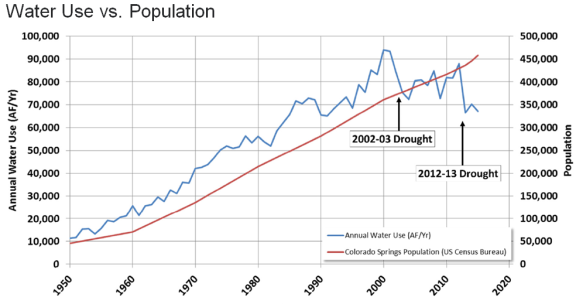
Buildout Could Nearly Double Existing Water Usage
CSU obtains water from three different river basins (Colorado, Arkansas, and South Platte) that is 70% west of the Continental Divide. The water is delivered to the City via the Homestake, Southern Delivery System (SDS), Blue River and Fountain Valley Authority pipelines. It is then treated at one of several treatment facilities and put into distribution.
Average annual system water use was approximately 70,000 acre-feet per year (AF/Yr) in 2015, and had a baseline demand of 88,000 AF/Yr assumed. Average annual availability was approximately 151,000 acre-feet per year. As a comparison, available water during the 2002 drought was only in the range of 53,000 acre-feet.
As of 2014, CSU had about 100,000 acre feet of developed water supplies and an additional 52,000 acre feet of developing or undeveloped supplies. From 2002 through 2014, system-wide usage averaged 164 gallons per capita per day (gpcd), while average single-family usage was around 94 gpcd. Over the past two decades, per capita demand has generally been trending lower. This is due to several factors to include more water efficient fixtures in new home construction and home refurbishing, drought and related watering restrictions, tiered/block water rates and the use of xeriscape among others. Decreased per capita consumption has resulted in extended capacity for the existing water storage and delivery facilities, reducing the short term need for additional capacity improvements capital expenditures. It is expected that the water conservation trend will continue, but the pace of conservation gains is expected to slow.
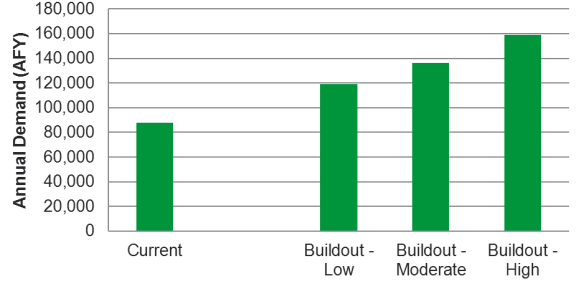
At full build-out of the CSU service area, it is anticipated that 119,000 AF/Yr to 159,000 AF/Yr will be required to service the needs of the community in an average year. A variety of options are being looked at for future water demand needs to include increased storage, purchasing new supply, conservation incentives and rates, non-potable water use, agricultural transfers, new conveyance, and groundwater among others.
Build Out Water Demand Forecasts
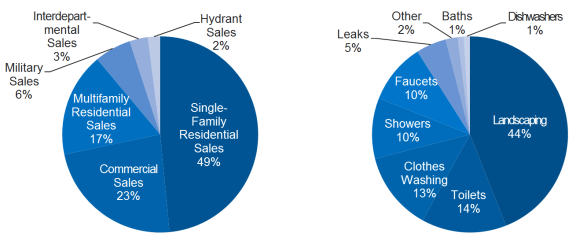
CSU Water Sales
Increasing Electrical Usage
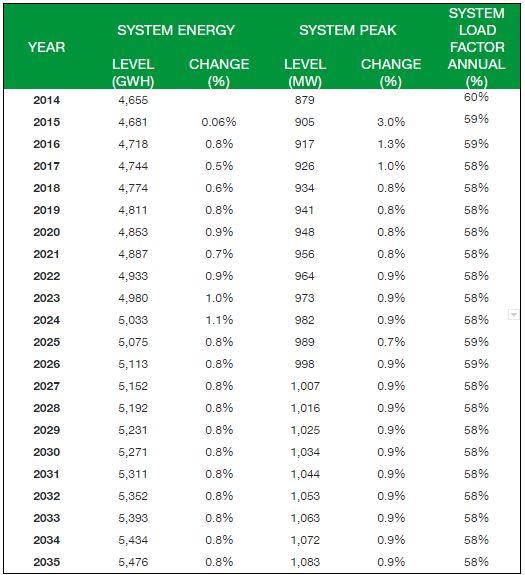
CSU delivers electricity to city residents, some adjacent jurisdictions, and military installations. Current annual demand is at approximately 4,800,000 mega-watt hours (MWh) with a system peak of approximately 900 MW. The transmission and distribution system contains over 3,500 miles of lines together with numerous substations and generating facilities.
Use of electricity on a per capita basis is not expected to increase due to efficiencies and sustainability being realized though new technology. However, there are uncertainties associated with these forecasts, including but not limited to the undermined market penetration of electric vehicles. Therefore, CSU projects a series of forecasting scenarios.
Electric Load Forecast
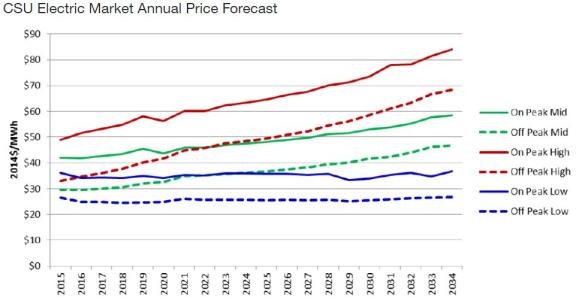
Continuing Increase in Electric Costs
Electric costs are expected to increase in the coming years with increased EPA emissions standards related to coal-fired and natural gas-fired power plants and as a result of CSU’s commitment to higher proportions of renewable electric supplies, and the closure of the coal-fired Martin Drake Power Plant in downtown Colorado Springs by 2035 or earlier. CSU has also started a program to utilize programmable thermostats that allow CSU to adjust home thermostat settings to shave peak system loading and costs to the consumer.
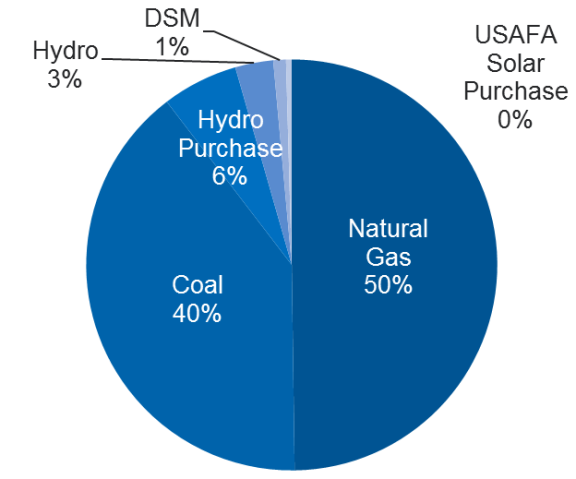
Growing Renewables
CSU is subject to and is supportive of the Colorado Renewable Energy Standard, which requires electric providers to utilize a minimum of 20% renewable energy production in their portfolios by the year 2020. CSU is on target to meet that goal and continue to increase that share in the years after 2020.
Capacity Mix
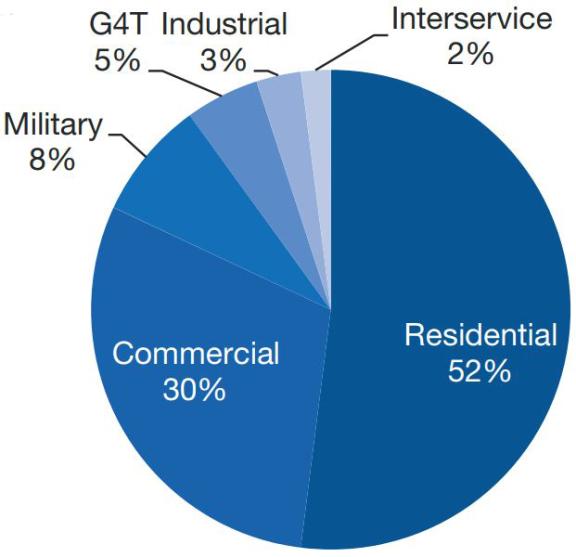
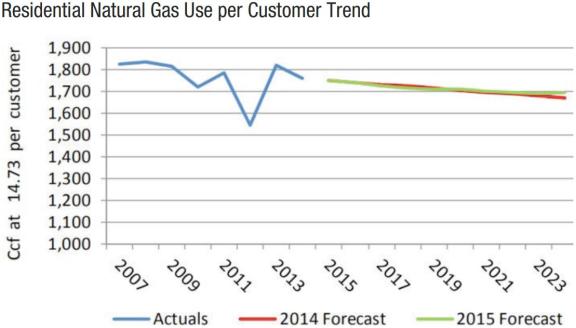
Increasing Efficiency in Natural Gas Usage
CSU delivers natural gas to City residents, some adjacent jurisdictions, and military installations. Current annual demand is at approximately 23 billion standard cubic foot (Bscf) with a system daily peak demand of approximately 300,000 thousand standard cubic foot (Mscf). The transmission and distribution system contains over 2,400 miles of pipelines together with numerous regulator stations to reduce system pressures.
Overall natural gas use is currently trending upward, while current residential use is trending downward. This is due to the use of higher energy efficient furnaces and appliances in addition to the use of more energy efficient building materials.
Gas Load Forecast, Ten Year Peak Load Forecast – Expected Scenario
| Period |
Winter |
Winter 2016-2017 |
Winter 2017-2018 |
Winter 2018-2019 |
Winter 2019-020 |
Winter |
Winter 2021-2022 |
Winter 2022-2023 |
Winter 2023-2024 |
Winter 2024-2025 |
|---|---|---|---|---|---|---|---|---|---|---|
| Daily Peak Demand |
291,357 | 295,611 | 300,310 | 305,442 | 310,507 | 315,400 | 320,295 | 325,225 | 330,215 | 335,256 |
| Hourly Peak Demand |
15,442 | 15,667 | 15,916 | 16,188 | 16,457 | 16,716 | 16,976 | 17,237 | 17,501 | 17,769 |
Source: Gas Integrated Resource Plan, 2015
Gas By Customer Type
Stable Natural Gas Costs
Natural Gas costs are expected to remain relatively stable for the foreseeable future due to the more recent development of increased supplies in the United States. Pipeline systems are also in place and being developed to transport gas to storage areas and for delivery to market. Costs of regulation and emissions guidelines are expected to increase, but at a manageable rate.
CSU Natural Gas Pricing
Parks + Recreation
What We Should Know About Where We Play
Colorado Springs is known as one of the top outdoor cities in the nation due to its location at the base of Pikes Peak; access to over 17,000 acres of parks and open space; and double the per-capita usage rates for these facilities as compared to similar communities. We are “ultra-users”! Studies show strong economic returns and health benefits from investing in recreational amenities. Our future challenges will be in identifying necessary funding options to retain and enhance this high level of community-valued amenities.
What Makes Colorado Springs a Top Outdoor City?
The City receives of 249 days of sun annually and has easy access to nearly four million acres of Rocky Mountain wilderness and a dozen world-class ski resorts. The City sits at the base of 14,115-foot Pikes Peak; the Arkansas's Class IV rapids; world-class athletic facilities (Carmichael Training Systems is based here); and miles of multisport trails and acres of parkland. The earliest Parks included North Cheyenne Cañon in 1885, Palmer Park in 1902, and Monument Valley Park in 1907.
With Pikes Peak, Bureau of Land Management, El Paso County and state parks, and the City’s own regional, community and neighborhood parks, there are 126,000 acres of parkland within a 15-mile radius of the City. This includes natural gems such as Pike’s Peak, Garden of the Gods, Cave of the Winds, and Seven Falls which attract residents and tourist alike.
The City boasts:
- 13,330 acres of city managed parkland
- 8 Regional Parks
- 9 Community Parks
- 137 Neighborhood / Mini Parks
- 3 Sports Complexes
- 5 Special Purpose Parks
- 49 Open Space Areas
- 178 Miles of Urban Trails
- 135 Miles of Park Trails
As the City continues to develop, new neighborhood parks, open space, community parks and sports complexes will need to be added in order to keep up with the needs of new residents. There are also over 900 acres of planned but undeveloped parks that need to be completed to achieve the level of service goals outlined in the 2014 Parks System Master Plan.
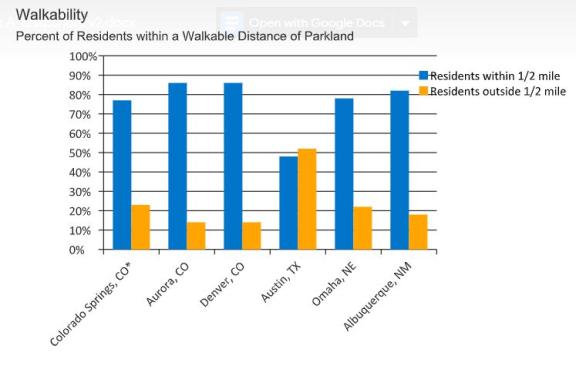
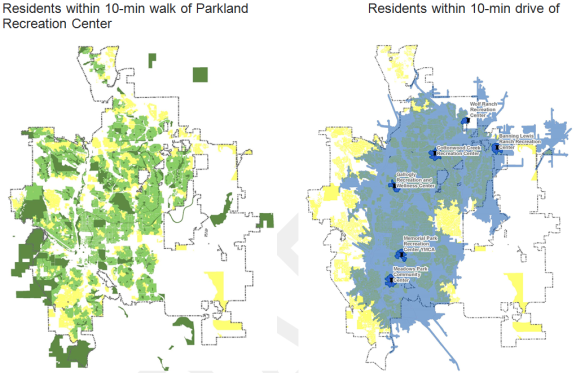
Easy Access to Parkland and Recreation Centers
Easy Access to Parkland and Recreation Centers
Use of parks and open space often depends on the accessibility and visibility of these community assets. Not surprisingly, with the high rate of park use in Colorado Springs, a majority of residents have an easy 10-minute walk of open space, a park, greenway, trail or other kind of parkland (77%). This indicates that the City parkland is well distributed and located to provide easy access for most current residents.
Similarly, close to 80% of homes are within a 10-minute drive of one of the six recreation and community centers in the City. On the other hand, Colorado Springs has a relatively low number of these centers, compared to similar cities. Boise has a similar number of recreation centers, serving half the number of people as Colorado Springs, and Austin has three times as many centers for twice as many residents.
Not Enough Resources For Parks
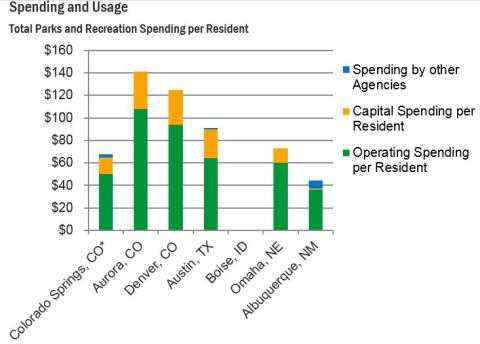
The City of Colorado Springs has a relatively limited parks and recreation budget, compared with other city parks and recreation departments. Per capita, this equates to about $65 for both capital investments and operations and management, which is less than half of what both Aurora and Denver spend. This indicates that the City is accomplishing quite a bit with a limited annual budget, but may be stretched too thin in the long term. This also affects the City’s ability to develop planned parks and maintain a high level of quality and care for existing parks, open space and trails.
Olympic City USA And Its Relationship To Urban Form
Colorado Springs is known as OLYMPIC CITY USA. As headquarters for the United States Olympic Committee, Colorado Springs is home to the Olympic Training Center, over 20 national Olympic governing bodies, more than 50 national sport organizations, and the future United States Olympic Museum. Athletes and coaches have long recognized Colorado Springs as the epicenter of the United States Olympic and Paralympic Movements. This importance infuses itself in the City’s educational, medical, technology, design, and cultural assets.
In 2009, Colorado Springs was rated the best community to live by Outside Magazine. Residents and businesses often select Colorado Springs due to its setting and access to the outdoors and nature. Colorado Springs has also been rated as one of the healthier cities in the country, and many new initiatives have been directed to improve health. We have found these initiatives have materialized in new capital investments for trail improvements and extensions and new policy changes such as the approval of cottage food industries.
Economic Benefits of Investing in Health, Parks and Recreation
There are certain benefits of a park and open space network that cannot be economically quantified, such as the mental health benefits or even carbon sequestration. However, research by the Trust for Public Land shows that a number of other aspects can absolutely show a direct financial benefit to residents and the City. For example, proximity to parks increases property values and subsequently property tax. Additionally, Colorado Springs residents save $56.5 million in medical care costs annually by using the parks and recreation system amenities to exercise. For the City’s bottom line, the natural cleansing and storage of stormwater by trees and plantings can save the City from additional stormwater treatment costs.
Parks play a major role in the City’s and the state’s tourism economy. Colorado tourism consistently outpaces the nation in travel and tourism growth, with Colorado attracting more outdoor visitors while nationwide this type of travel declined in 2015. The dip in visitors after the 2012 Waldo Canyon and the 2013 Black Forest fire and flooding has made a full recovery, with Colorado Springs attracting record visitors and tourism revenue in 2016. This is in no small part due to the City’s natural beauty and outdoor tourism destinations. Garden of the Gods is one of the most visited city parks in the nation, with over 2,000,000 annual visitors.
The access to and availability of parks and recreational opportunities has become is one of the primary reasons an individual’s choose to live or locate their businesses in Colorado Springs. Prospective residents and employers are attracted to locations that offer these amenities, as they improve a community’s quality of life and provide an important benefit to the local economy.
*****
Renowned Culture
Community Character
What We Should Know About What Defines Us
The built environment of Colorado Springs, from our architecture and sculpture, parks and wide boulevards - to our identification as Olympic City USA - helps define our iconic individualism. By the 1940s, Colorado Springs was known for its neighborhood pride and traditional community gathering places. Over time, historic areas have been identified, and today we recognize 432 individual neighborhoods. As we look forward, a structure for better identifying, rejuvenating, and enhancing the character in many of the neighborhoods has begun and will continue through the prioritization and development of neighborhood plans.
Strong History, Identity And Culture
Colorado Springs was founded in 1871 by General William Jackson Palmer as a resort destination for tourists visiting the American West. He played a major role in developing the area with his investment in the Denver and Rio Grande Railroad. Neighborhood pride and identity was as strong then as it is now, with a great variety of architectural beauty and design, as well as key gathering areas such as the YMCA. With the discovery of one of the richest gold strikes in American history, Colorado Springs saw a boom in population and wealth in the 1850-60s and again in the 1890s, making it known as the “City of Millionaires.” At the turn of the 19th century, Colorado Springs was the wealthiest per capita city in the nation. During this growth period many of the historic buildings in downtown were removed and there was a focus on new construction.
There are still 60 nationally recognized historic landmarks and another 20 state recognized landmarks just within the city limits. This includes five historic districts, and 65 individual historic places, reflecting the strong roots in the mining industry, railroad expansion, early health and educational institutions, and social and civic life. The City has supported historical preservation for three decades. The City’s Historic Preservation Board helps preserve and enhance the City’s history and heritage using tools such as the unique Historic Preservation zoning overlay district, design standards for historic districts, and the Historic Preservation Plan.
A City Built On Its Neighborhoods
The residents of Colorado Springs hold significant pride in the neighborhoods where they live. These neighborhoods are where residents invest their money –purchasing a home is often the largest investment one will make– and their time, through neighborhood volunteerism and local HOA and neighborhood organization boards. With 432 different recognized neighborhoods within Colorado Springs, residents will testify to their individual character and how each neighborhood offers something different. Similar to branding efforts in other cities (Denver’s Lodo and Capitol Hill neighborhoods or Minneapolis’s Lowry Hill), residents are moving to preserve and amplify the unique identities of each neighborhood, to strengthen their brand and make them more recognizable.
Conversations with Colorado Springs residents illuminated the collective desire to have more walkable neighborhoods with a mix of uses: residential, retail, office, etc., moving away from isolated single-use districts. By creating pockets of walkable and bikeable commercialism and gathering places, Colorado Springs’ neighborhoods can become interconnected through their different amenities.
From stakeholder interviews, it is apparent that residents desire the pedestrian-scale environments and tangible identities that set distinct neighborhoods apart from the more commercial and corporate structures of society. They want to live in a place where repeated casual and spontaneous interactions can occur with neighbors, friends, and business owners. This greater urban trend of city-dwellers preferring to live, work, and play within a shrinking radius will continue to impact the development patterns of Colorado Springs.
Residents also seek safe neighborhoods. Overall, crime in Colorado Springs is higher than the national average, varying by neighborhood but over time, Colorado Springs has become safer and there is a desire for this trend to occur across all neighborhoods.
The City continues to capitalize on the value of the neighborhood through introducing more mixed-use development, neighborhood infill, and adaptive reuse projects. For example, not long after the historic Ivywild School was closed, a group purchased the building and transformed it into the new center of the neighborhood as a gathering place for community and commerce.
Aside from the design guidelines for the historic districts of Colorado Springs, there are a half dozen other plans that outline standards and design guidelines for specific zoning and overlay zones, corridors, or other special areas in the City. Most of these plans are implemented through the Comprehensive Plan or by regulation in the City Code. Colorado Springs’ commitment to streetscape design excellence is also reflected in being part of Tree City USA for over 40 consecutive years –the longest-serving Colorado community. Currently, 20% of the City is covered with trees, which is a strong percentage for a city in the plains, where not a lot of trees are naturally found. As the City looks forward, a structure for rejuvenating many of the neighborhoods has begun through the development of neighborhood plans, including those in the southeast where some areas suffer from disinvestment.
Although Colorado Springs has a framework of neighborhoods and a community organization in place (Council of Neighbors and Organizations) to advocate for them, our neighborhood identity and identification process is incomplete, and many neighborhoods are not fully organized. Additionally, only a minority of mature, established areas of the City have a city-initiated neighborhood plan in place; where these plans do exist they are often 20 or more years old. Finally, at this time, there is no comprehensive framework in place to determine which neighborhoods should have the highest priority for new or updated neighborhood plans.
The Importance Of Arts + Culture
Long before General Palmer founded the City of Colorado Springs, the area attracted many groups of people and cultures. Home to the Ute, Cheyenne, and Arapaho Native American tribes, among others, the Pikes Peak region has played host to diverse cultures and civilizations for centuries. When General Palmer arrived in Colorado, he saw that diversity of cultures as the cornerstone of civilization. It was through Palmer's original contributions to our society –through facilitating the creation of important civic institutions and fostering parks, tourism, higher education and intellectual interaction– that Colorado Springs began to become the city it is today.
Although the intrinsic value of arts and culture is indisputable, throughout the world and at home in Colorado Springs, the economic capital attributable to the arts is becoming more respected and recognizable. The Cultural Office of the Pikes Peak Region estimates that the non-profit arts industry alone generates over $70 million within the Pikes Peaks region annually, and creates over 2,000 local jobs. When creative businesses are included, Americans for the Arts puts the number of jobs created at around 10,000. Additional revenue of over $40 million comes from El Paso County artists and galleries.
The impact of the renowned arts in Colorado Springs directly benefits the City’s tourism industry. The Springs is repeatedly found on lists of top art destinations, and ranks in the top 50 of 276 metropolitan areas nationwide in number of arts businesses per capita. The community receives over $50 per person per day above the national average in additional expenditures when non-residents visit for a show or arts event, as they frequently choose to dine, shop, and stay in the area before or after the event.
As younger professionals migrate to urban centers across the nation, they are repeatedly considering the arts and culture of a place when choosing where to live. The presence, quality, and quantity of music venues, entertainment centers, museums, galleries, public art, and art opportunities are increasingly playing a significant role in attracting new businesses and individuals. As the arts have proven to weather economic uncertainty, and drive local innovation and economic development, residents of Colorado Springs are pressing for further investment in the City’s arts and cultural scene.
Thriving Economy
Economic Trends
What We Should Know About How We Work And Do Business
Across the board, the City is advertising more jobs than it can fill. The City’s unemployment at the beginning of 2018 was at a low 3.8%. Job opportunities in military, cybersecurity, the sports ecosystem, and healthcare are abundant, and in some cases openings in these robust sectors have been difficult to fill. The economy and associated jobs will continue to evolve over the next 20 years with less emphasis on traditional long-term employment with fixed hours and more need for office space that nimbly adapts to changes in technology and market demand. Although many jobs will continue to be tied to a physical location, employers will have more choice in where to locate their jobs, and many knowledge workers will be less tied to one work location. Within this evolving context, enhancing urban amenities and housing options is expected to increasingly be a factor in attracting and retaining top talent.
Stability And Growth In Key Sectors
Military employment is expected to remain stable and defense spending accounts for an estimated 40% of the Pikes Peak region’s economy. Healthcare continues to grow, as roughly $1 billion was invested in hospital expansions in 2016. Registered nurses are currently the most in-demand position in Colorado Springs. Across the board, the City is advertising more jobs than it can fill.
Tourism is also stable and has a solid outlook. Hotel rates hit a 20-year high, 500+ hotel rooms have recently been added or are currently under construction, and airport traffic is up. While sports and outdoor recreation might be the biggest draws, arts & culture are growing segments of the tourism economy; Pikes Peak Performing Arts visitors number grow significantly each year, and the Olympic museum is expected to significantly increase visitors. Promoting and enhancing Colorado Springs attractions can help in other sectors like healthcare and tech.
Competition For Cybersecurity Talent
Colorado Springs is the top U.S. city in terms of concentration of cybersecurity firms (100+ firms). The confluence of military, jobs, and quality of life make the City a major competitor for cybersecurity talent. The City is home to the National Cybersecurity Center, and its National Cyber Symposium. However, Colorado Springs will increasingly compete with cities like Salt Lake City, San Antonio, and Washington D.C. for top talent. By a handful of measures, young skilled professionals might prefer amenities in one of the City’s competitor cities, if given a choice. The four competitor cities, for example, each have at least one “cool” neighborhood listed in the Cool Streets report, while Colorado Springs has none. Walk Score, along with Transit Score and Bike Score describe a city’s overall walkability, accessibility, density, and livability. Colorado Springs ranks comparatively lower than other cyber competitor cities in each. Similar to cybersecurity, Colorado Springs ranks in the top ten best places to find a job in technology, but competes with the likes of San Jose, San Francisco, Washington D.C., Seattle, Austin, Boston, and Dallas, that all have a distinct advantage in terms of urban amenities.
Downtown Economic Development
In general, from tech to healthcare, the professional services sector increasingly leans toward more urban, walkable setting to cater to young creative talent. Companies increasingly locate in places where their employees can easily choose from a variety of modes to travel among home, work, entertainment, services and shopping. In the cybersecurity world, urban amenities matter: According to Gensler’s Top Workplace Trends, “…companies will be under greater pressure to find the best employees, balance work modes, and broaden their locational options. Urban areas with transit access and a mix of nearby amenities are in play, adding a layer of security requirements for the owners and developers of buildings catering to the sector.”
Downtown Colorado Springs is well positioned to become a significant economic hub. It already accounts for about 29,000 jobs, and has over 500 recently added housing units already completed or under construction. A state-of-the-art Olympic Museum is slated to open in 2019, two large hotel projects are in process, and two sports venues are in the planning stage. One strong indicator metric is commercial office vacancy; Downtown (defined as zip code 80903) experienced 13% vacancy in 2015 compared to 20% citywide. ESRI estimates show that the professional, scientific and tech services industries accounts for nearly a quarter of all Downtown businesses, more than double the percentage in the City. Yet, only 4% of the Colorado Springs workforce lives Downtown, compared to 10+% in competitor cities. There is an emerging live-work-play life-style in downtown Colorado Springs which is not yet well-known.
Fiscal Sustainability
What We Should Know About How We Invest
Well over 25% of the land within the City is owned and managed for the benefit of the public. These uses include parks, open space, transportation rights-of-way, utility corridors, stormwater ponds and channels, schools, and a variety of other public facilities. PlanCOS provides a unique opportunity to understand how growth, development, redevelopment, and reinvestment choices affect the City’s current and future fiscal condition. Understanding this relationship can help inform land use and policy decisions leading to a fiscally sustainable and resilient comprehensive plan to guide future city decision-making. The fiscal sustainability of additional growth outside of the city boundary and lack of intergovernmental agreements with neighboring municipalities will also continue to be an issue.
Building a Strong Economic Base
Colorado Springs has a diverse economic base, with strong anchoring sectors leading the way. We are a national leader in the aerospace, aviation, defense, and cybersecurity industries. Along with the presence of the Air Force Academy and our other military installations, these industries are a top economic engine for our City, creating some of the world’s most innovative technologies and attracting and producing highly-skilled talent. Higher education institutions, including UCCS (University of Colorado, Colorado Springs), Colorado College, Pikes Peak Community College and technical colleges, also drive the local economy forward, producing highly-skilled talent for our City’s employers to draw from. UCCS is expanding rapidly as the identified growth campus for the entire University of Colorado system.
Colorado Springs’s role in a thriving economy starts with our brand-as Olympic City USA. This brand needs to be part of us. We are home to numerous headquarters, governing bodies, and related sports organizations as well as many former and future Olympic athletes, thanks to our unparalleled natural training grounds and conditions. This has helped create a diversified sports economy, with businesses focused on training and fitness, equipment manufacturing, and technology. The Olympic City brand and regular athletic events, as well as access to great local parks and the Rocky Mountains, has also fueled a strong local tourism market that is an economic driver for our City.
From these strengths, modern technology-based industries have emerged and are growing. Colorado Springs ranks in the top ten amongst U.S. cities for finding a job in technology. We have a growing number of businesses partnering with healthcare providers and research institutions to create innovations in the medical technology sector. In addition to our strength in cybersecurity, we have a thriving information technology industry developing software for a variety of industries, and we have become a leading location nationally for datacenter operations. The confluence of higher education institutions, military installations, trainees and retirees, and quality of life make Colorado Springs a strong contender for technology and engineering talent.
Readiness of physical sites, availability of financial incentives and a qualified workforce are key drivers for economic development and business attraction. Quality of place is increasingly important in attraction and retention of a talented workforce, particularly in industries with desirable, well-paying jobs. With our natural landscape, access to outdoor activities, quality K-12 schools and higher education institutions, and a relatively affordable cost of living, it is no wonder that Colorado Springs consistently ranks as one of the best cities to live.
The Colorado Springs Chamber & EDC focus its efforts on assisting with the expansion and retention of existing employers, which yields the majority of job growth, as well as on attracting new businesses to the region. Keenly aware of the wage gap that is growing nationally, the Chamber & EDC also emphasize creation of living-wage and higher salaried jobs. The City can support these efforts by ensuring it creates desirable site and neighborhood conditions for workers, businesses, and residents. This means ensuring that the above strengths remain in place, focusing on creating quality infrastructure, housing that is affordable and attractive to people of all income levels, and neighborhoods in which people want to live. Many skilled workers have strong preferences for compact, walkable, unique settings with easy access to recreation and entertainment. The City’s investments and regulations can create this type of physical environment that attracts businesses and skilled workers, as a part of the broader economic development strategy.
Balancing service standards and ability to pay for services
Fiscal sustainability is the ability of a local government to pay for public services and infrastructure at an established level of service. To determine whether a combination of land uses is fiscally sustainable, a fiscal impact analysis can be conducted. Fiscal impact analysis enables local governments to estimate the difference between the public costs to provide services and infrastructure and the sales and property taxes, user fees, and other revenues generated.
A fiscal impact analysis is different from an economic impact analysis, which evaluates the economic benefits to a community in terms of jobs, income, and economic output—some of which may not have a direct fiscal effect on local government finances. In all communities, there are fiscal “contributors” and “recipients.” One goal for future growth is to achieve a mix of land uses that results in a balance of contributors and recipients thus achieving fiscal sustainability for the locality as a whole.
Cost of Growth
What We Should Know About How We Pay For Growth
The PlanCOS process can help identify where existing infrastructure and services can accommodate additional growth in the City, where current development patterns are fiscally beneficial, and where redevelopment makes sense fiscally. This is also an opportunity for meaningful dialogue on cost burdens and community priorities for services and infrastructure that ultimately can be embedded in PlanCOS policies and goals.
Understanding The Costs Of Growth Outside Our Boundaries
In the short term, development outside of city limits appears to cost less, as initial infrastructure costs are paid by the developer. However, long-term costs for upsizing and operations and maintenance have future consequences for the community. Developments closer to the core of the city are typically less expensive to serve long-term and have ancillary benefits to a community. Potential exceptions to this—not inconsequentially—are places with aging and inadequate infrastructure needed to support intensified redevelopment.
The impacts have been summarized as follows:
- Two sets of infrastructure are being created and both are underutilized: the one Americans are running away from (cities and older developed suburbs) and the one they never catch up with (the new spreading development). This development pattern results in overly high costs to local governments, developers, and housing consumers. As a result, taxes are increasing in the older communities due to excessive capacity in their infrastructure and in the sprawl developments due to the need for required systems to serve new growth, including such physical infrastructure items as community water and sewer. (Burchell, Costs of Sprawl, 2002)
On the other hand, Burchell’s research has found that “[s]prawl does provide less expensive single-family housing at the periphery of metropolitan areas… it provides “congestion management” due to the suburb to suburb work trip… and allows a choice in community settings including smaller, more accessible local governments.” Furthermore, it has been argued that annexation allows for a locality to capture a larger tax base particularly in fiscally struggling localities.
Who Benefits and Who Should Pay?
In Colorado Springs, the current policy is for the private sector to construct on-site and off-site (adjacent) public facilities with the expectation that ongoing urban services (e.g., public safety) will be funded with General Fund revenues.
Paying for public services presents a set of tensions. Certain types of services are more appropriate to be funded with general tax dollars because they are a public good and benefit all of a community, rather than an individual (e.g., public safety). At the other end of the continuum, some types of services can be viewed as more appropriately funded with user fees because the benefit is directly enjoyed by an individual (e.g., development services such as building permits). Still others are a mix of both community and individual benefits and therefore appropriate to be funded with a combination of general tax dollars and fees. Because of these issues, local governments often establish policies regarding acceptable thresholds for cost recovery from fees while considering social and economic factors. The City of Colorado Springs recently adopted a user fee policy that sets cost recovery levels for City departments to use in setting a fee structure. The following policy guide is from the City’s User fee Policy.
*****
| Cost Recovery Levels | Cost Recovery Percentage Range | Policy Considerations |
|---|---|---|
| Low | 0%-29% |
|
| Medium | 30%-69% |
|
| High | 70%-100% |
|
Infrastructure Investment Shared Between Private And Public
A key element in the Mayor’s Strategic Plan is “Investing in Infrastructure.” This is more than an investment in expansions of infrastructure system but rather an acknowledgment that investing in the City’s existing infrastructure is essential for long-term economic and fiscal success.
The City Council has identified the need to develop a “long-term, realistic funding and action plan” to fund infrastructure improvements. Currently, private development is required to provide on-site infrastructure as well as adjacent off-site facilities only when necessitated by the specific development. However, the City has not generally required development to pay for its fair share of system-level improvements with a few exceptions.
Revenue Trends
What We Should Know About How Much Funding We Have
Like most municipalities in Colorado, Colorado Springs is dependent on sales tax revenues to fund core services and infrastructure. Current per capita retail spending in the City is just above the statewide average. However, shifts in consumer behavior (with a trend toward online purchasing which is often tax-free) and demographics in the City may have a direct effect on our future fiscal sustainability. Anticipating these trends and seeking to mitigate negative fiscal impacts through physical planning and policies can create quality places and opportunities to maximize revenue.
Increasing The City's Tax Revenues
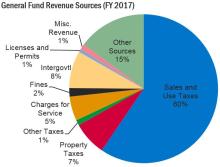
Like most cities in Colorado, sales and use tax revenues are the major source of revenue in the General Fund. In Colorado Springs, sales and use taxes comprised 60% of the City’s General Fund budget, as of 2017. Reliance on a relatively volatile revenue source such as sales tax requires the City to be diligent in preparing for inevitable economic downturns.
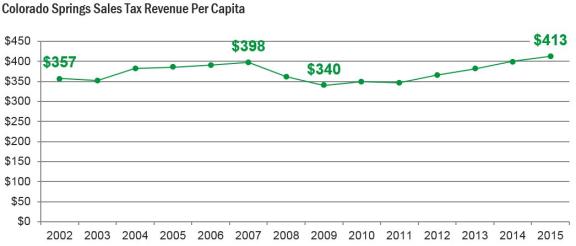
Through 2017, the City has experienced a 21% increase in per capita sales tax revenue since the low point of 2009, while population has grown by 10% over the same time period. This has allowed the City to somewhat catch up with deferred costs and services resulting from the Great Recession.
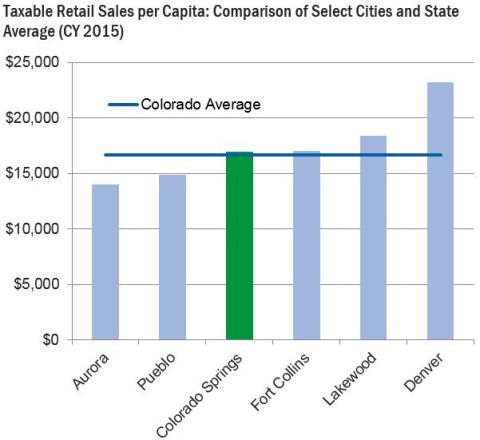
Compared to other Colorado cities and the state, taxable retail sales per capita in Colorado Springs is close to the statewide average and in the mid-range of comparable cities.
In communities reliant on sales tax revenue, retail development is often aggressively pursued. However, the retail landscape is changing rapidly with an ever increasing share of purchases being made online. Despite the majority of purchases still being made at bricks and mortar establishments, almost all growth in retail sales nationally is taking place online.
What is even more important for sales-tax dependent localities like Colorado Springs is that the goods that are shifting to online sales are those goods that comprise taxable goods —therefore reducing sales tax revenues collected locally over the long term.
Colorado Springs has revenue limitations due to the provisions of the State Taxpayers Bill of Rights (TABOR) and the City Charter. TABOR essentially caps annual City revenue based on a growth formula that is applied to the City’s previous year actual revenue or TABOR revenue limit, whichever is less.
The TABOR limitations present two key challenges for the City:
- City revenue received above the annual revenue cap must be refunded to local taxpayers or can be retained via voter approval. This results in limited opportunities to invest one-time surpluses.
- Applying the growth formula to the previous year’s actual revenues in years when revenues are lower than the TABOR limit ratchets down the revenue limit thus negatively affecting subsequent years when revenues begin to increase.
Expenditure Trends
What We Should Know About How We Spend Public Dollars
Lower per capita city revenues has resulted in fewer dollars available for core facilities and services compared with many other communities. PlanCOS provides an opportunity to understand and consider implications of these expenditure trends as well as assumptions related to the physical development and care of our City.
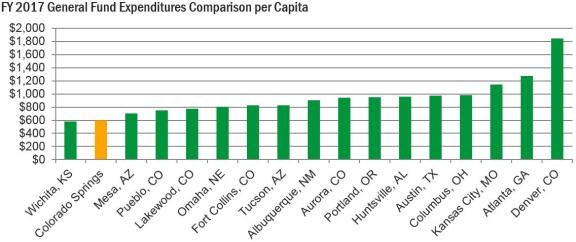
Spending Habits Are Based On Available Revenue
Cities provide a range of services at varying levels of service. The City of Colorado Springs spends less per capita for City services than comparable cities in Colorado and elsewhere, which is likely due to the Colorado Springs’ revenue limitations. It should be noted that the expenditures shown reflect General Fund expenditures only. For some jurisdictions General Funds can be a reflection of the amount spent on general services. However, some general services can be funded through non-General Fund sources of revenue (such as the City of Colorado Public Safety Sales Tax).
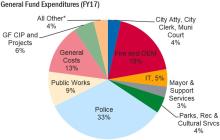
Year 2017 General Fund expenditures totaled $272 million with just over 50 percent spent on public safety. The costs shown do not include the additional funding of $32 million from the City’s dedicated Public Safety Sales Tax (PSST) and also does not include additional expenditures for the City’s 5-year voter approved “2-C” sales tax. Furthermore, the PSST ballot issue requires that the City expend at least 49% of its General Fund revenues on public safety.
Special Districts
What We Should Know About How We Publicly Finance
The City allows the use of special districts to reimburse developers for a share of public infrastructure costs and, increasingly, as a means to finance the ongoing maintenance of community facilities not maintained by the City. Given prior decisions to allow districts and the City’s revenue constraints, this tool is likely to stay in place for future generations. However, PlanCOS provides an opportunity to review special district policies in light of other larger discussions on, “Who should pay for what?”, as well as to identify possible changes to special district policies in line with PlanCOS goals and objectives.
A Widely Used Funding Tool
To help pay for infrastructure needed to serve new development, special districts are used throughout Colorado. Special districts are “special purpose governments” established to provide public financing through property tax mill levy to pay for public capital facilities and occasionally to operate and maintain those public facilities. The use of Special Districts has grown significantly over the past 15 years in Colorado with a fivefold increase in the number of districts throughout the state. There can also be issues with existing districts and overlapping entities, when properties are annexed into the city.
Special districts used in Colorado Springs include Metro Districts, Business Improvement Districts, General Improvement Districts, and Special Improvement Maintenance Districts. Special districts are useful tools in places with revenue constraints due to TABOR, like Colorado Springs. In Colorado Springs, as of 2017 special districts of all types reflect approximately 20 percent of total City property value and Metro Districts reflect approximately 10% of total City property value.
The Perception Of A Heavy Tax Burden
Title 32 special districts often impose much higher property tax levies as compared with the City and El Paso County. This means that residents of these districts may be more averse to approving future general purpose property tax increases because of their higher relative tax burden. Currently, the City of Colorado Springs accounts for almost all of the property value in El Paso County special districts and a little over half of metro districts.
The reality for Colorado communities —and particularly Colorado Springs— is that given property tax limitations, use of special and metro districts is an essential tool for new development to be able to provide infrastructure. This creates a system of multiple “typical tax payers” with tax rates varying across the City based on location inside or outside a special or metro district.
What also varies widely is the actual tax rate (levy) from district to district —particularly in metro districts. While the City’s property tax mill levy is 4.279 (per $1,000 in market value), special district property tax mill levies can range upward to 50 mills depending on the district. Levies vary across the City with an additional $16 million generated by special district property tax mill levies in the City, as of 2017. This amount reflects almost double the amount of General Fund property tax revenues generated, and is expected to increase rapidly.